About 1,748 geothermal wells in the United States, majority in California
 ThermaSource Rig 108, The Geysers (Source: ThinkGeoEnergy)


In an extensive analysis, Matt Uddenberg of Stravan Consulting LLC provides a great overview on geothermal wells drilled in the U.S., overall revenues and required maintenance.
In a great overview article, Matt Uddenberg of Stravan Consulting LLC looks at the maintenance of geothermal wells in the U.S. He kindly allowed us to republish his article here on ThinkGeoEnergy.
Analysis of available public data has revealed that there are approximately 1,748 geothermal wells in the United States, most of which are located in California. Figure 1 shows the location of power plants in the United States and a breakdown of useable geothermal wells by state. Total electrical production of the geothermal industry in 2017 was 15,976,000 MWh per year [1]. The average PPA price in California, which is the biggest market is $70.3/MWh [2]. Given these values, the estimated revenue for the U.S. geothermal energy industry in 2017 was $1.16 billion. Looking at the past 10 years of data provided by the US Energy Information Administration, the average annual growth for the geothermal market is approximately 0.8% from a combination of plant optimization, well repair, and addition of new production wells.
Annual Operation and Maintenance (O&M) costs have been calculated for the U.S. geothermal industry to estimate the potential market size for well maintenance. Equation (1) was chosen to approximate O&M costs because it was developed using published data and anecdotal knowledge collected by Geothermex Inc [3]. In most cases, O&M costs are not publicly available given their sensitivity. This makes estimating average O&M cost across the industry exceedingly difficult. Even though Equation (1) is based on data from 2003, it provides a rare glimpse of how O&M cost are distributed across the industry.
Co = 2.0e-0.0025(P-5) (1)
where:
Co = Cost of O&M
P = Power (total) generated in terms of MW/year.
O&M costs for each plant were calculated in 2003 dollars and then adjusted for inflation. The total estimated O&M cost for the U.S. geothermal industry in 2017 was approximately $268,706,200. To better calculate the market size for well maintenance, the percentages of O&M budget for well remediation and upkeep were estimated at 5–15% based on professional experience (actual data are not available). These values are based on anecdotal knowledge and experience with power plant operations. This assumption excludes the cost of pump “push-pulls”– the replacement of soon to fail or failing downhole pumps. Hence, a general estimate of the total geothermal well maintenance market in 2017 was between $13,435,300 and $40,305,900. Further detail is necessary to determine how to prioritize and target potential clients for companies hoping to pursue this opportunity.
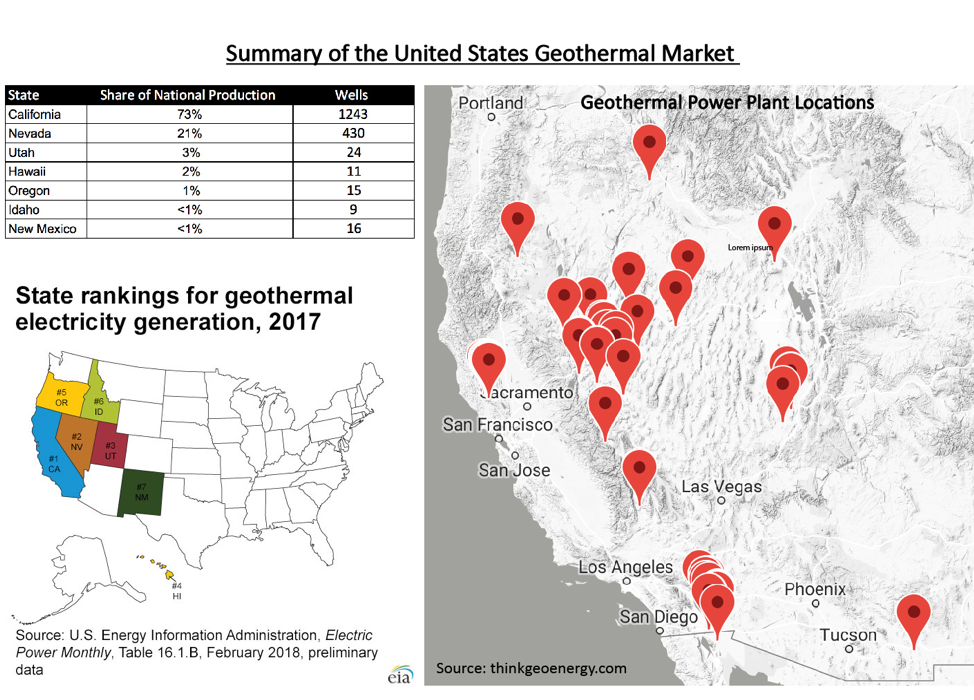
Figure 1. Overview of power plant locations, state ranking in terms of power production and non-abandoned commercial wells. Location of geothermal plants in Alaska and Hawaii are not shown, there is one power plant in each of these states.
There are 414 active producing steam wells in California, which holds over 95% of the steam wells in the United States. There are no good data on the frequency of failure for these wells in California, but a survey of geothermal wells in Southeast Asia drilled during the 1990s shows that single string cased wells fail at a rate of about 2.5% annually, and wells with a liner lap fail at a rate of about 9% annually [4]. These observed rates likely underestimate the real failure rate as there was not adequate high-resolution and high-frequency data for all the wells covered in the study.
Steam wells are also plagued by precipitation of mineral scale which inhibits production. Scale results from the boiling of water inside the wellbore or the interaction of steam with water infiltrating the casing through a leak. Precipitation of minerals in the wellbore is a common problem and is not often categorized as a leak, even though leaks in the casing or cement are likely to be an underlying reason for its occurrence. Even if we include instances of these precipitation events as casing failures, the rate of failure is likely no greater than 10% on an annual basis. Therefore, on the high-end, there are 40 potential wells that require mitigation of casing leaks in steam dominated reservoirs.
There are roughly 823 wells found to be described as high temperature water wells in California. Based on data from the California Department of Oil, Gas and Geothermal Resources (DOGGR), 150 of these wells are idle and 656 are active (Figure 2). Idle wells are those which are not being produced but have not been abandoned; in many cases, they are connected to a power plant through piping. The reasons for idling a well generally fall into five categories: lack of pressure, lack of connectivity to the resource, well failure or obstruction, lack of temperature, or short circuiting. Idling of a production well occurs for two major reasons:
- Reservoir pressure is reduced by a significant enough amount that the well can no longer be pumped at economic levels without cavitating the pump.
- Temperature of the produced fluids is below the economic threshold. This is often caused by short-circuiting within the reservoir.
The idling of an injection wells also occurs for two major reasons:
- The well does not offer enough pressure support to the producing part of the field.
- The well is found to cause short-circuiting within the reservoir.
Geothermal plant operators are always trying to optimize production from their well-field. For binary power plants, operators seek to maximize production flow without causing rapid temperature decline. Injection wells that have good communication with the producing part of the field will provide the pressure support necessary to maximize the flow. However, injection wells too closely connected to production will cause short circuiting or rapid temperature decline. An operator must balance these two forces to maximize production over the lifetime of the power plant, an effort complicated by the fact that communication between wells can also evolve over time. Pressure and thermal effect from injecting cold water into a reservoir can increase the permeability of fracture pathways, potentially creating new short circuit pathways.


Figure 2. Active vs. idle wells for all geothermal wells located in California. A) All wells; B) Comparison of high temperature water wells used in binary power plants. Data from the California Division of Oil, Gas and Geothermal Resources.
From the database provided by DOGGR, there is not a clear way to quantify why a well has been become idle. However, it is possible to determine whether an idle well is located near a production zone, in which case the well is either not very permeable or has caused short circuiting. Wells affected by short-circuiting present a large opportunity. By conducting well maintenance or sealing off specific fracture zones associated short-circuiting, wells could potentially be put back into service for small capital investments. Small improvements in production can quickly offset the cost of well work. This payback period is often fairly straight forward to model. In the California dataset, roughly 18% of the high temperature water wells are idle, Figure 3. A survey of all the available databases found ~1,320 high temperature water wells in the US, thus ~232 idle wells are estimated.
Short circuit mitigation is not limited to idle wells. Production wells experiencing rapid or unsustainable temperature declines are also candidates for improvement. However, it is likely that a smaller portion of these will be good candidates for well work overs or mitigation measures. This is because operators are less likely to take production wells off-line or risk damage to these wells from work-over activities. Unlike in the steam field, wells in water dominated reservoirs will only need to be treated once or only a few times during their entire useful lives.

Figure 3. The distribution of different types of wells for both active and idle wells. Data from the California Division of Oil, Gas and Geothermal Resources.
Notes:
The information being shared has been assembled from public data repositories and press releases. This information should be a fairly accurate representation, >=90% accuracy, of the current market. Not all states require robust reporting on geothermal assets, making high 100% accuracy difficult to achieve.
Some of the information presented was assembled for projects funded by AltaRock Energy, Inc.
[1] EIA, 2018. Cost and Performance Characteristics of New Generating Technologies, Annual Energy Outlook 2018. US Energy Information Association, February, 3pp.
[2] GEA, 2016. 2016 Annual U.S. & Global Geothermal Power Production Report. Geothermal Energy Association, March, 36 pp.
[3] Sanyal, S. 2004. Cost of Geothermal Power and Factors That Affect it. Proceedings, Twenty-Ninth Workshop on Geothermal Reservoir Engineering, Stanford University, January, SGP-TR-175.
[4] Southon, J. 2005. Geothermal Well Design, Construction and Failures. Proceedings World Geothermal Congress 2005. Antalya, Turkey, April, 6pp.
Source: Matt Uddenberg, “Geothermal Well Maintenance” via Medium


