Mapping geothermal power generation – our approach to research and our power plant map
In this recording of a presentation from November 2020 with IGC events, we share details on our research and approach to map geothermal power plants globally.
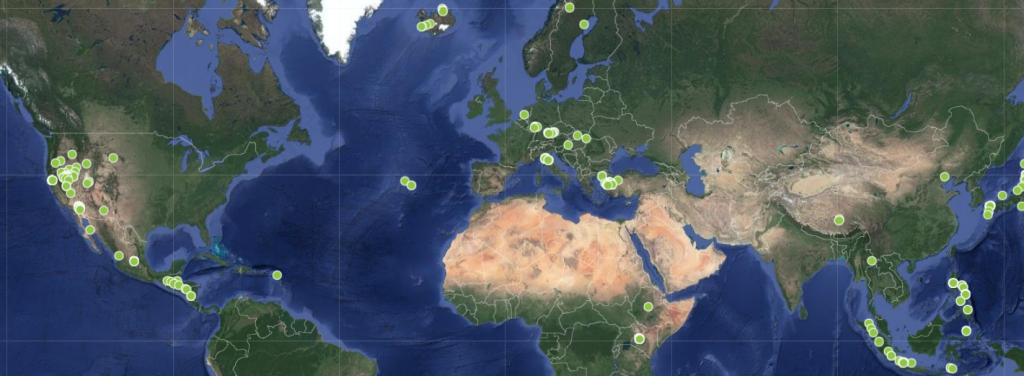
In November 2020, ThinkGeoEnergy relaunched its Global Geothermal Power Plant Map. The map features all the geothermal power plants of this world, the name, country, installed capacity (MW), and technology (Binary, Dry Steam or Flash plant). This builds on top of the extensive research done by ThinkGeoEnergy and a database including all geothermal power plants and all power projects under development.
Through our partnership with IGC events and Enerchange, I gave a presentation on the map and ThinkGeoEnergy’s research activities. I explain how we approached listing the plants and how we are collecting/ recording data.
The presentation shares some of the key findings of our research related to power generation, top operators, the share of turbine technology etc.
Regarding the approach to the plants shared on the map, we have set it up to show plants that are operating, yet also included a number of significant plants in a geographic context that are not operating or have since retired. These are though only a handful. Otherwise, we have decided to show only plants that are operating. The “installed capacity” does not reflect the operating capacity, which we have in our database but not show as part of the “pop up” for each plant.
The “plants” shown are often a “plant group”, which combines several units of a plant on one location. Our database contains 522 plant units, which does not translate into actual turbine units, rather a set up of clusters, e.g. the first phase of a plant with 2×45 MW turbines would be “one plant”, while an extension that is located distinctively away would be another “plant” (this could be one turbine unit, but also two different sized turbine units).
Our power plant map shows the name of the plant, the country, the installed power generation capacity in MW, and the technology.
As part of our reporting of plants here for the map and our annual Top 10 Geothermal Countries List, you will find discrepancies with the data reported by different sources. There are various reasons for the different numbers reported by these entities and the numbers presented by ThinkGeoEnergy.
Some organisations report gross capacity, others operating, others installed capacity, while others take averages of summer and winter capacity. They all have one challenge in common and that is that countries and organisations are often not presenting the same numbers. The result is that numbers for one country cannot be compared with another.
So some time ago, ThinkGeoEnergy decided to apply installed nameplate power generation capacity, but only reflect that capacity that is operating – no matter if the plant produces at full capacity or not. We try our best to exclude plants and MW that are not operating, but it is not easy. For some countries one simply has three or four different data sets and needs to make a decision that might prove to be wrong in the end.
Our research is based on three main sets of databases, one for all geothermal power plants (represented here in the map with a fraction of the data we collect for each plant), one for geothermal power generation projects worldwide and one for all companies engaged in geothermal development.
If you want to correct locations for plants or think a plant is missing, please don’t hesitate to drop us a line at news@thinkgeoenergy.com with the Google Map coordinates (right-click on the location and copy this number set).
