Berkeley study compares the net value of geothermal to other renewables
A study from the Berkeley Lab analyzes the net value of renewables to determine why geothermal development has been lagging in the Western U.S.
A study written by Mark Bolinger, Dev Milllstein, Will Gorman, Patrick Dobson, and Seongeon Jeong from the Lawrence Berkeley National Laboratory analyzes the net value for geothermal, wind, solar, and solar plus storage in the western United States. The end goal for this analysis is to determine why the geothermal power projects have been deployed to a much lesser extent compared to wind, solar, and storage in recent years.
The full paper “Mind the gap: Comparing the net value of geothermal, wind, solar, and solar+storage in the Western United States” has been recently published in Renewable Energy (https://doi.org/10.1016/j.renene.2023.02.023)
The lagging growth of geothermal
Despite the early commercial success of geothermal in the United States back in the 1980s, the growth of this sector in recent years has lagged behind solar and wind. In the past decade, the geothermal capacity in the six Western states with geothermal (California, Idaho, Nevada, New Mexico, Oregon, and Utah) has increased by less than 0.5 GW. This is in stark comparison compared to the 5 GW of wind and 20 GW of utility-scale solar capacity growth within the same period.
Yet, there remains a lot of potential for geothermal power generation in the Western states. Of the estimated 39 GW of identified and undiscovered resources, only 3.7 GW have been developed. The study states that the limiting factor for geothermal deployment is not potential or resource availability, but rather the economic viability of developing these resources.
Determining the net value of renewables
To assess the economics of geothermal development, the study proposed a metric called the net value. Put simply, the “net value” of a renewable resource is defined as the combined energy and capacity value of a resource minus its average PPA price.
To jump ahead to the results, the study concludes that the net value of geothermal is lower than that of other renewable energy sources. The geothermal net value has even been found to be negative for a significant period covered by the study. This net value comparison goes a long way towards explaining the disparity in the deployment rate of geothermal versus other renewables over the last decade.
Comparing historical PPA prices
The prices at which power generated by renewable sources are sold at are mostly determined through Power Purchase Agreements (PPA). A fixed-price revenue helps de-risk renewable projects and attract investment, particularly for capital-intensive facilities. The study draws upon extensive databases by the Berkeley Lab of historical PPA prices for wind, solar, and solar+storage. These were then supplemented with a new database of geothermal PPAs.

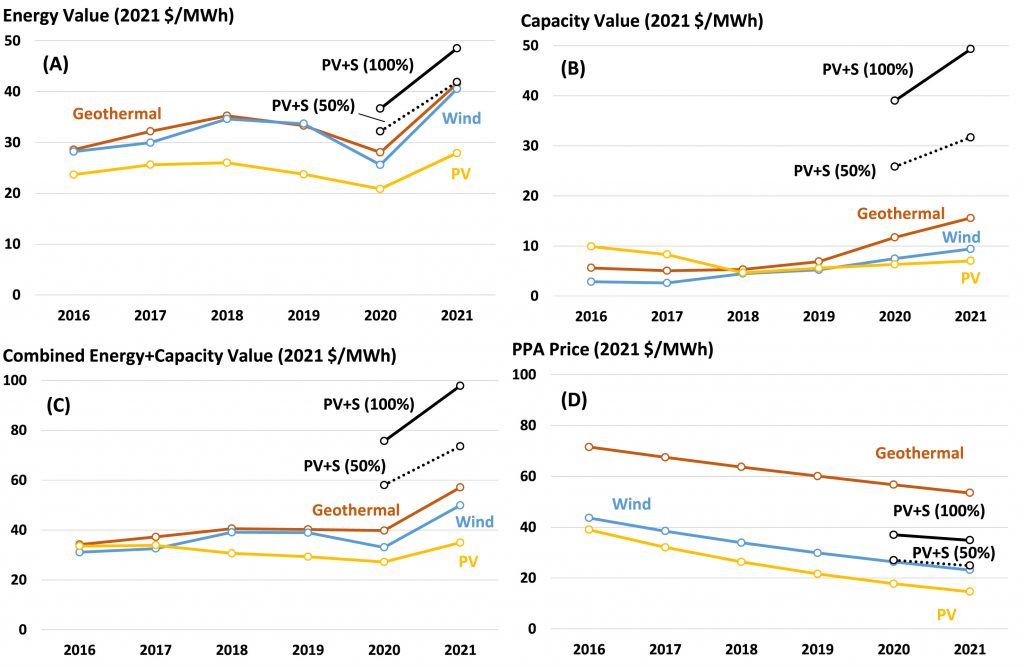
The figure shows that the PPA prices for geothermal have not fallen in recent years by as much as the wind and solar PPA prices. This has led to a widening cost gap. The study notes that comparing the PPA of geothermal to wind and solar is not a fair comparison, given that geothermal provides a baseload resource compared to the weather-dependent and intermittent solar and wind.
To provide a better comparison, the PPA prices of geothermal were compared to that of solar PV+storage. Using this comparison, the price advantage of PV+storage shrinks to about $20/MWh.
The study goes on to extrapolate PPA prices for renewables, concluding that the price gaps are not projected to change vastly until 2026. As of 2021 figures, the cost gap against geothermal is $39/MWh versus PV, $30/MWh versus wind, $29/MWh versus PV+storage (50% storage ratio), and $19/MWh versus PV+storage (100% storage ratio).
Comparing the market value of renewables
Another metric used in the study was the market value of a resource, itself measured in terms of energy value and capacity value. The energy value reflects the degree to which the output of a resource correlates with higher or lower energy prices over time. The capacity value is defined as the product of a resource’s capacity credit multiplied by the prevailing capacity price.

In terms of the combined energy + capacity value, geothermal holds a distinct advantage over standalone wind and solar. However, combining a battery with solar significantly boosts its energy and capacity value.
Net value comparison through 2021
Bringing all the cost and value elements together yields a “net value” for each renewable resource. This is ultimately what the study uses to determine the relative economic viability of geothermal versus other renewables.
The study shows that the net value for each renewable resource has grown steadily over the last five years. However, the net value of geothermal remains the lowest and was even negative (costs were exceeding value) before 2021. This metric provides a possible qualitative measure that explains the lagging deployment of geothermal in the Western US compared to other renewables.
Legislative and consumer efforts are paving the way for geothermal
The study presents 2026 projections for the net value of renewables, showing that geothermal can have the largest net value increase within the period. However, a number of initiatives can help accelerate the increase of this net value.
Notably, the California Public Utilities (CPUC) issued a Mid-Term Reliability Decision requiring the procurement of 1000 MW of weather-invariant, zero-emission capacity generation by all California load serving entities by 2026. This has resulted in the signing of geothermal PPAs by several Community Choice Aggregators including CC Power and Peninsula Clean Energy.
Although such demand may lead to increased PPA prices in the short term, the flurry of new activity may accelerate the learning curve of geothermal, leading to lower costs. The study states that wind, solar, and batteries have all benefitted from “deployment-related learning-by-doing.”
The efforts of the U.S. Department of Energy’s Geothermal Technologies Office to fund geothermal-related R & D initiatives may also help lower the cost of geothermal project development. For instance, the Enhanced Geothermal Shot has earmarked USD 200 million to accelerate breakthrough in enhanced geothermal systems.
Enhancing the value of geothermal as a potential resource for lithium extraction is also a key area of study in California, particularly in the Salton Sea. In late 2022, the Lithium Valley Commission published a final report of findings and recommendations on harnessing the geothermal lithium potential in California.
Considering all these developments, the study states that the potential for geothermal development in the Western U.S. is brighter than a purely quantitative analysis of net value would suggest.
Source: American Public Power Association and Bolinger et al.


